
Your £59 per month Tableau Creator license is likely failing to solve the "Last Mile" of your data integration. While off-the-shelf tools offer a quick start, they often hit a wall when faced with complex, bespoke business logic or the need for a truly unified source of truth. If your team is still manually exporting CSVs into Excel to bridge the gap between platforms, you aren't just losing time; you're losing the competitive edge that real-time insights provide. Investing in custom reporting dashboard development allows you to bypass the limitations of generic software and build a high-performance architecture that grows with your business.
While we focus on the dashboard architecture, businesses often benefit from integrating broader automation; in such cases, working with a specialized AI agency like Lighthouse Group can help design custom AI agents that further streamline your digital operations.
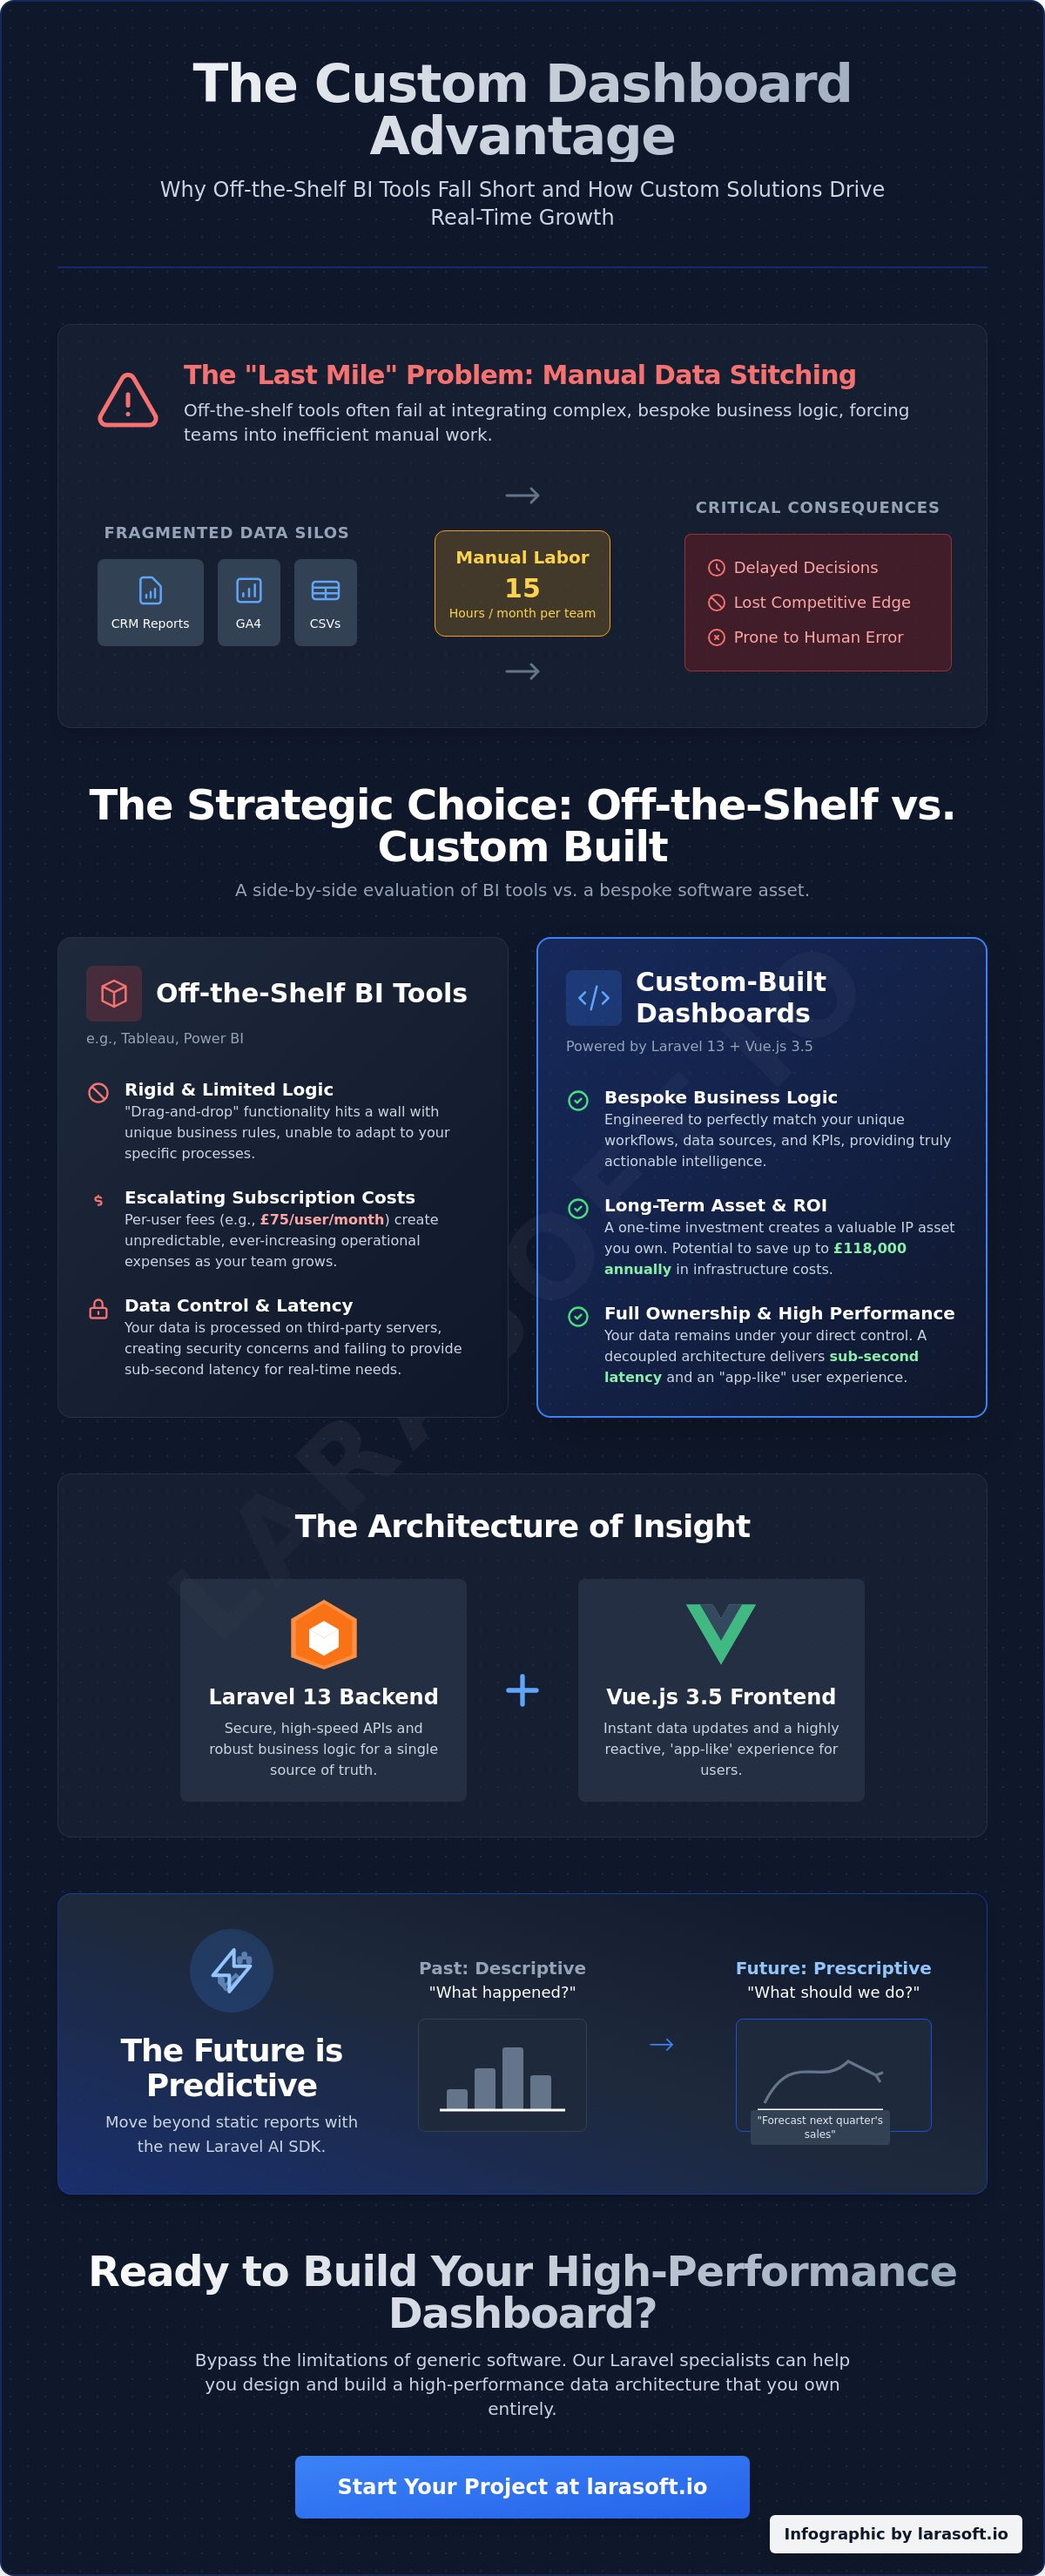
We understand that the transition from fragmented silos to a streamlined system feels like a high-stakes technical hurdle. This guide will show you how to leverage the latest advancements in Laravel 13 and Vue.js 3.5.34 to build secure, scalable platforms that you own entirely. You'll learn how to integrate the new Laravel AI SDK to automate complex analysis and replace manual reporting with a sophisticated, automated engine. We'll explore the strategic shift toward cloud-native architecture that can save your organization up to £118,000 in annual infrastructure costs while ensuring your data remains under your direct control.
Custom reporting dashboard development is the engineering of bespoke web applications designed to ingest data from disparate sources, apply your unique business logic, and present actionable intelligence in real time. It's not just a visual layer for your spreadsheets. In May 2026, the demand for these systems has surged as UK businesses grapple with increasingly complex API ecosystems and the non-negotiable requirement for sub-second latency. The goal has shifted. We're no longer just asking "what happened" in the last quarter. We're building systems that answer "what should we do right now" by moving from descriptive to prescriptive analytics. Your data should work for you, not the other way around.
For many UK firms, the daily routine involves a "manual export" ritual. This is the time-consuming process of downloading data from various platforms and trying to make sense of it in a spreadsheet. It's inefficient and creates a lag between data collection and decision-making. Professional custom reporting dashboard development replaces this friction with automated pipelines. By centralising your data, you move from reactive firefighting to proactive strategy, ensuring your leadership team has the clarity needed to scale.
Most teams rely on platform-native tools like GA4 or standard CRM reports. These are helpful for isolated metrics, but they create the "Data Silo" problem. Industry observations indicate that UK marketing teams spend an average of 15 hours per month simply stitching CSV files together to get a complete view of their customer journey. This manual ritual is prone to human error and delays critical decisions. By developing business dashboards that integrate directly with your tech stack via custom APIs, you eliminate the friction and create a single, unified source of truth.
There's a specific threshold where off-the-shelf BI tools become a liability. When your business logic is too complex for "drag-and-drop" filters, or when the per-user licensing costs of tools like Tableau (£75 per month) start to outweigh the value of the insights, it's time to pivot. Choosing a bespoke application allows you to own your infrastructure. This isn't just a software purchase; it's the creation of an intellectual property asset for your firm. For UK companies dealing with technical debt, this process often begins with legacy code modernisation to ensure the underlying data pipelines are robust and secure. Ownership of the code means ownership of your future growth.
Architecture is the silent engine of business intelligence. While generic tools rely on rigid, pre-built templates, the foundation of successful custom reporting dashboard development lies in a decoupled, "headless" approach. This involves separating the data processing backend from the visual frontend. By using Laravel 13 as the core engine, we ensure that your data remains secure, accessible via high-speed APIs, and structured for maximum scalability. Laravel's service layer abstracts complex business logic into clean, testable code, allowing for multi-stage data transformations that are significantly more efficient than the brittle, SQL-heavy calculated fields found in generic BI tools.
The synergy between Laravel and modern frontend frameworks like Vue.js or React creates an "app-like" experience that traditional reporting servers simply can't match. As of May 2026, the release of Vue.js 3.5.34 has further improved reactivity, enabling dashboards to update instantly as new data flows in without requiring a page refresh. This technical stack isn't just about aesthetics; it's about providing your team with a high-performance tool that feels intuitive and responds at the speed of thought. If you're ready to move beyond generic templates, our team of Laravel specialists can help you map out a high-performance architecture.
Managing large datasets requires more than just a powerful server. We focus on optimizing database queries through advanced indexing and Eloquent ORM refinements to ensure sub-second response times, even as your data grows into the millions of rows. We balance accuracy with system performance by implementing sophisticated caching strategies using Redis, ensuring that your most critical KPIs are always available. Leveraging vue.js frontend development allows us to build seamless user interactions where filters and date ranges apply instantly, providing a fluid experience that keeps users engaged with the data.
A dashboard is only as good as the data feeding it. We build secure pipelines that connect disparate systems, from global CRMs like Salesforce to custom legacy databases unique to your UK operations. This strategic approach to custom reporting dashboard development ensures that all data is validated and cleaned before it hits your screen. By implementing a secure API architecture, we protect your sensitive business information while allowing for the seamless flow of data across your entire tech stack. This ensures that the insights you see are not only fast but consistently accurate and reliable.
Choosing between a subscription-based BI tool and a bespoke software asset is a defining strategic decision for any data-driven organisation. While platforms like Power BI, Tableau, and Looker offer a low barrier to entry, they often function as "black boxes" that struggle with complex, non-standard business logic. When your reporting requirements move beyond simple aggregations into multi-stage data transformations, these drag-and-drop interfaces often hit a "Feature Ceiling." This is where custom reporting dashboard development provides a distinct advantage, allowing you to build a system that conforms to your business processes rather than forcing your processes to fit the tool's limitations.
Security and data residency are also paramount for UK firms operating under strict regulatory frameworks. Off-the-shelf tools often require you to grant third-party access to your sensitive data or host it on their proprietary clouds. A bespoke solution built with Laravel allows you to maintain total ownership of your data and the infrastructure it sits on. You aren't just renting a service; you're building a proprietary asset that adds tangible value to your company's intellectual property. This level of control ensures that your reporting remains compliant, secure, and entirely under your jurisdiction.
Per-user licensing fees can escalate quickly as your organisation grows. As of May 2026, a Power BI Pro license costs approximately £11 per user per month, while a Tableau Creator license sits at roughly £59 per user. For a 100-user organisation, this results in an annual expenditure ranging from £13,200 to over £70,000. These are perpetual costs that offer no equity. In contrast, the upfront investment in custom reporting dashboard development creates a scalable platform with zero per-user fees, often resulting in a lower total cost of ownership over a three to five-year horizon. You also avoid the need for highly specialised "BI Analysts" to manage complex, brittle workbooks that standard web developers can't easily maintain.
Generic BI tools are designed to serve everyone, which often means they serve no one perfectly. This leads to "Dashboard Fatigue," where users are overwhelmed by cluttered interfaces and irrelevant metrics. We focus on creating role-specific views that deliver exactly what each stakeholder needs. An executive might require a high-level summary of the "Three Numbers" that drive the business, while an analyst needs deep-dive capabilities. By prioritising a mobile-first, minimalist design, we ensure that your team can access critical insights on the move, leading to significantly higher adoption rates than cumbersome, desktop-only BI reports.
Success in custom reporting dashboard development isn't a matter of luck; it's the result of a disciplined, five-step architectural journey. We begin with Stakeholder Discovery to map the "Three Numbers" that truly drive your business decisions. Identifying these core metrics early prevents the clutter that often plagues generic tools. Once the goals are clear, we move to a comprehensive Data Audit. This involves identifying all data sources and assessing their cleanliness. If your current systems are struggling, this stage highlights where legacy code modernisation is required to build a stable, secure foundation for your new insights engine.
The transition from concept to code requires meticulous Prototyping and UX Design. We validate the visual flow and user interactions before the heavy lifting begins. This ensures that the final dashboard is not just functional but a tool your team actually enjoys using. During Agile Development, our craftsmen build the core engine using Laravel 13 and PHP 8.3, integrating APIs to create a seamless data flow. The process concludes with Testing and Deployment, where we fine-tune the system to ensure sub-second performance and absolute data accuracy across all reports.
Most dashboards fail because they provide too much data and not enough insight. We avoid this by translating high-level business goals into specific technical KPIs. By identifying the primary users and their specific "Jobs to be Done," we tailor the experience to solve real-world problems. Whether it's an operations manager tracking real-time logistics or a CFO monitoring cash flow, the dashboard must deliver immediate value without unnecessary noise. This focus on utility ensures high adoption rates across your organisation.
When dealing with sensitive financial or operational data, a robust QA process is non-negotiable. We employ iterative feedback loops and build in two-week sprints, allowing you to see progress and provide input throughout the cycle. This collaborative approach ensures the final tool aligns perfectly with your vision. We also provide full documentation and training for your internal teams, ensuring a smooth handover and long-term maintainability. If you're ready to transform your fragmented data into a proprietary asset, you can start your development journey with our specialist team today.
Larasoft approaches custom reporting dashboard development as a partnership between your industry expertise and our technical craftsmanship. We don't just build interfaces; we architect solutions that solve specific business challenges. We understand that your business logic is unique. Generic templates can't handle the nuances of UK-specific VAT regulations or the complex supply chain workflows of a growing enterprise. Our process starts by deeply understanding these internal processes. We treat your software not as a cost centre, but as a proprietary engine for growth. By focusing on the longevity and scalability of our work, we ensure that the system we build today remains robust as your data volume increases.
Many UK organisations struggle with data trapped in systems that are a decade old. Our team specialises in bridging this gap, using Laravel 13 to wrap legacy databases in modern, secure APIs. This ensures that your historical data isn't just preserved; it becomes a functional part of your future strategy. Under our "Your vision, our code" philosophy, we ensure every line we write serves a specific ROI goal. This focus on clean, efficient code is what distinguishes a professional build from a temporary fix. We build systems designed to work perfectly under pressure, providing the steady reliability your leadership team requires.
Standard dashboards tell you what happened yesterday. By integrating the Laravel 13 AI SDK, we move your reporting into the realm of predictive intelligence. We use machine learning models to provide predictive trend analysis, helping you anticipate market shifts before they appear in standard charts. Natural Language Processing (NLP) allows your team to "ask" the dashboard questions like "What was the net profit margin for our retail segment in Q1?" without navigating complex filters. Automated anomaly detection acts as a 24/7 monitor, identifying risks such as sudden drops in conversion rates or inventory discrepancies before they escalate into costly operational issues. This transformation from static metrics to active intelligence is a core part of modern custom reporting dashboard development.
Our identity as dedicated Laravel specialists is at the heart of everything we do. We take immense pride in the cleanliness and efficiency of our code, ensuring that your software is a foundational asset for the next decade. Based in the UK, we provide the local expertise and high-level communication that complex software projects require. We don't believe in one-off products; we offer ongoing software maintenance to ensure your system remains at the cutting edge as technologies like Vue.js 3.5.34 evolve. If you're ready to secure your data ownership and transform your business intelligence, contact Larasoft to discuss your custom reporting dashboard project today. We find genuine satisfaction in building systems that deliver clarity and command respect through their performance.
The transition from fragmented data silos to a unified intelligence engine is a critical step for any UK business aiming to scale in 2026. By moving away from the recurring costs and technical limitations of off-the-shelf BI tools, you gain total control over your business logic and data security. We've explored how a headless architecture using Laravel 13 and Vue.js 3.5.34 provides the sub-second latency required for real-time decision-making. Professional custom reporting dashboard development isn't just about visualization; it's about building a proprietary asset that transforms static metrics into predictive, AI-driven insights.
As a specialist Laravel development agency, Larasoft is dedicated to turning your technical challenges into manageable journeys toward growth. Our UK-based team of software craftsmen brings deep expertise in legacy code modernisation, ensuring that even your oldest data sources contribute to your future success. We don't just provide a service; we act as your technical ally to ensure your software remains scalable and secure for years to come. Ready to transform your data? Book a consultation with our Laravel experts and start building the foundation for your next stage of growth.
A standard project typically takes between 12 and 24 weeks to complete. The timeline depends on the number of data sources and the complexity of your internal business logic. We spend the first 4 weeks on discovery and architecture to ensure the foundation is robust. This disciplined approach ensures the final tool delivers the sub-second latency required for modern enterprise operations.
In May 2026, UK development costs generally range from £20,000 for a streamlined MVP to over £400,000 for complex, enterprise-grade platforms. Most mid-complexity projects fall between £60,000 and £200,000. While the upfront investment is higher than a subscription, you eliminate per-user licensing fees which can save a 100-user firm over £70,000 annually compared to premium BI tiers.
We can integrate with almost any existing system through bespoke API development. Our expertise in legacy code modernisation allows us to extract data from older databases and wrap it in secure, modern protocols. This process ensures your historical records are unified with current data streams, creating a single source of truth without requiring you to replace your core operational software.
We implement enterprise-grade security protocols, including AES-256 encryption and robust multi-factor authentication. Unlike third-party BI platforms, your sensitive business data remains on your own infrastructure or a private cloud under your direct control. This architectural choice ensures full compliance with UK GDPR and protects your proprietary information from the risks associated with third-party data access.
Custom reporting dashboard development provides total ownership of the code and the data, whereas tools like Power BI are rented services with rigid logic. A bespoke solution handles complex transformations that "drag-and-drop" tools often fail to execute. You gain a proprietary asset tailored to your exact workflow, removing the "feature ceiling" and perpetual per-seat costs associated with commercial BI licenses.
You don't need to hire an internal team because we offer dedicated software maintenance packages. We act as your technical ally, handling all security patches, server optimisations, and feature updates. This gives you the peace of mind that your dashboard remains at the cutting edge of technology while allowing your core team to focus on strategic business growth rather than code management.
Every dashboard we build is fully responsive and optimised for mobile access. We use Vue.js and React to create "app-like" experiences that work seamlessly on smartphones and tablets. This allows your executives to monitor the "Three Numbers" that drive the business from anywhere, ensuring that critical insights are always available, whether they are in the boardroom or travelling.
AI transforms your dashboard from a passive display into a proactive business advisor. By integrating the Laravel 13 AI SDK, we enable features like automated anomaly detection and predictive trend analysis. Users can also perform natural language queries, asking the system specific questions about performance rather than manually digging through charts, which significantly increases the speed of data-driven decision-making.
Here’s what we've been up to recently.
Certified Quality. Great Prices